
Geocoding every HDB in Singapore

What is a HDB? Click here.
I’ve been learning Python for a few months and wanted to see what I could do with a large dataset. The website data.gov.sg has some great open source datasets to choose from, and I found one called HDB Property Information which contained the addresses of all existing HDB blocks in Singapore, along with the highest floor level, year of completion, type of building and number of flats per block.
I wanted to map each location, but although I had the addresses of over 12,000 HDBs, they didn’t come with their corresponding geographical coordinates.
This is when I first found out about geocoding.
After some research (and a lot of trial and error) I was able to write a script in Python to automatically geocode every single HDB in Singapore.
import googlemaps
import pandas as pd

addresses = pd.read_csv("Full_Addresses.csv")

gmaps = googlemaps.Client(key = 'This_is_my_API_key')
addresses['lat'] = None
addresses['long'] = None

for x in range(len(addresses)):
    geocode_result = gmaps.geocode(addresses.loc[x, 'Full_Address'])
    try:
        lat = geocode_result[0]['geometry']['location']['lat']
        lng = geocode_result[0]['geometry']['location']['lng']
        addresses.loc[x,'Lat'] = lat
        addresses.loc[x,'Lon'] = lng
    except:
        lat = None
        lng = None

addresses.to_csv('address_coords.csv')
My Python code connected to Google Maps’ API which then requested the latitude and longitude of every address in the list.
Originally the script I wrote was too fast, and I was going way over Google’s API limit of 50 requests per second. After some changes, I managed to slow the script down to within the accepted limits, and within a couple of hours, I had the exact location of every HDB in Singapore.
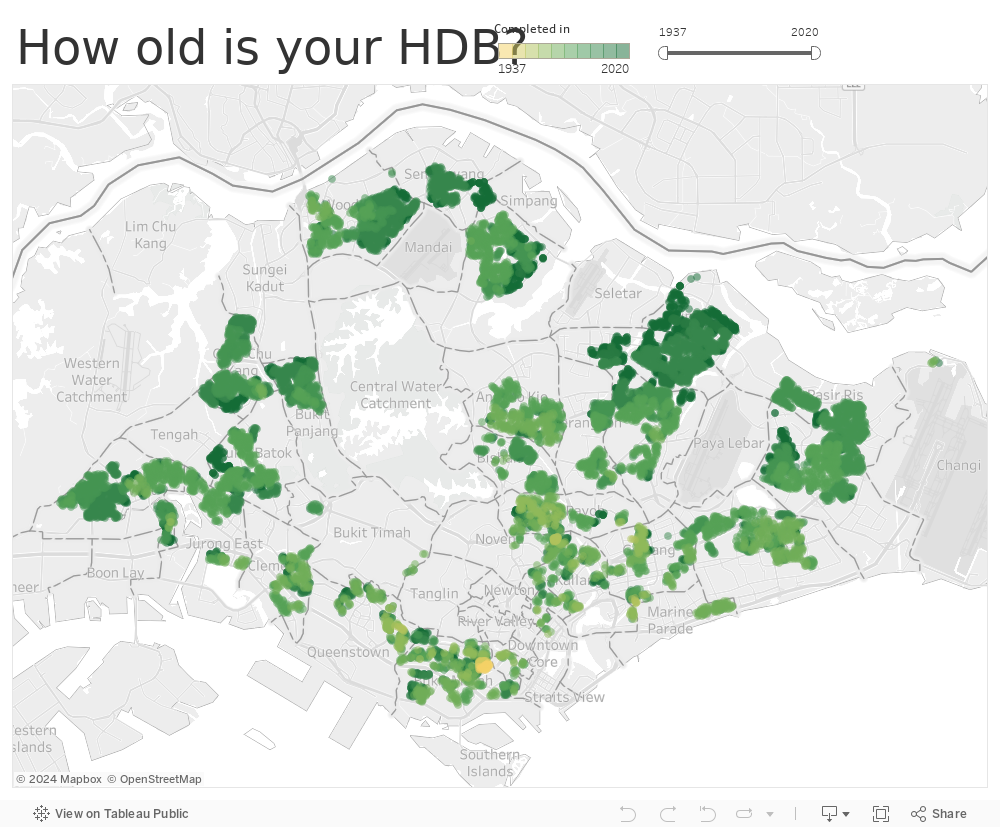
I then used Tableau to plot all points and filtered by the year the building was completed to see how the HDBs have spread throughout Singapore over time.